Seaport's Price Tag Is the Highest in Boston. The Money Isn't Following It.
As of this spring, a 10,609-square-foot penthouse at the St. Regis Residences on Seaport Boulevard had been sitting unsold since it first listed in June 2025. The price was cut to $44.5 million in January 2026, and by April the unit had logged more than 300 days on the market without a buyer. The broker marketing it told the Boston Globe his search for a buyer means working boat shows and yacht brokers from Manhattan to Palm Beach, because the pool of people who can write that check barely exists in Greater Boston. Finding a buyer at that level, he said, means digging like a reporter, not just showing a listing.
That penthouse sits inside a 114-unit building where roughly 47 units, more than 40 percent of the building, remained unsold as of late 2025, a count that market snapshots through the spring of 2026 showed hadn't moved much. It's the same building that, more than any other single address, is responsible for Seaport carrying Boston's highest price per square foot. That's the part worth sitting with before you use "highest price per square foot" as a shorthand for "strongest market."
Seaport's condo market has held the highest price per square foot in the city all year. A snapshot from March 2026 put the median near $1,940 per square foot. A more recent summary covering the 30 days ending in early September 2026 still had it running $1,781 to $1,816 per square foot, well above Back Bay's roughly $1,450 to $1,630 range from that same March window. On paper, that reads as unambiguous strength.
Underneath it, the picture splits. The Real Deal reported that sales above $3 million across Boston's urban core fell 35 percent year over year in a recent quarter, with overall condo sales down 11 percent over the same span, citing data from Collaborative Companies. Developers who added roughly 2,500 luxury units between 2019 and 2025 are now the ones absorbing that slowdown, and St. Regis is the clearest example: a building that opened behind schedule into a soft market and is still working through unsold inventory. The Boston Globe reported in March 2026 that new investors were stepping in to reposition the project and try to restart sales momentum.
None of that means Seaport buyers vanished. It means the buyer pool for anything priced like a trophy asset has gotten dramatically thinner, and sellers in that tier are quietly offering closing-cost credits and price concessions to move units that are expensive to carry.
The mistake would be writing off the whole neighborhood. A March 2026 snapshot showed 135 Seaport Boulevard trading with real confidence, with recent trades and listings ranging from roughly $1,506 to $1,939 per square foot, and mid-market units in established buildings generally moving in 30 to 46 days. Older addresses like 50 Liberty and Pier 4, which opened years earlier, had already sold through their original inventory by the time St. Regis was still working through its unsold units. The neighborhood's underlying demand drivers, a dense employment base within walking distance and continued public investment along the waterfront, haven't gone anywhere.
What's changed is the ceiling. The building, the floor, and the fee structure now matter more than the ZIP code on the listing. A unit at 135 Seaport Boulevard and a unit at St. Regis can trade at similar prices per square foot today, but one sits in a building that's already sold through and the other sits in a tower still carrying dozens of vacancies. A neighborhood-level median treats those two trades as identical. They aren't.
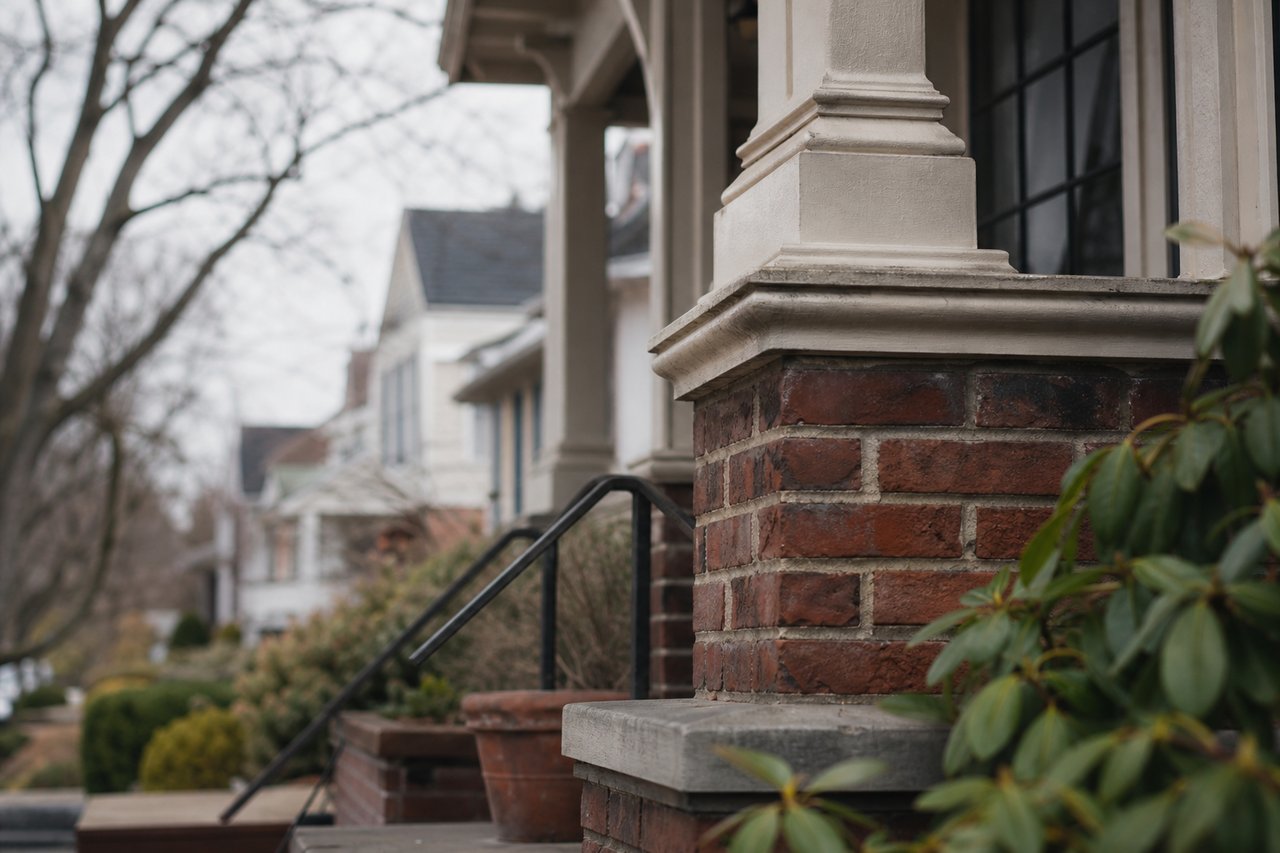
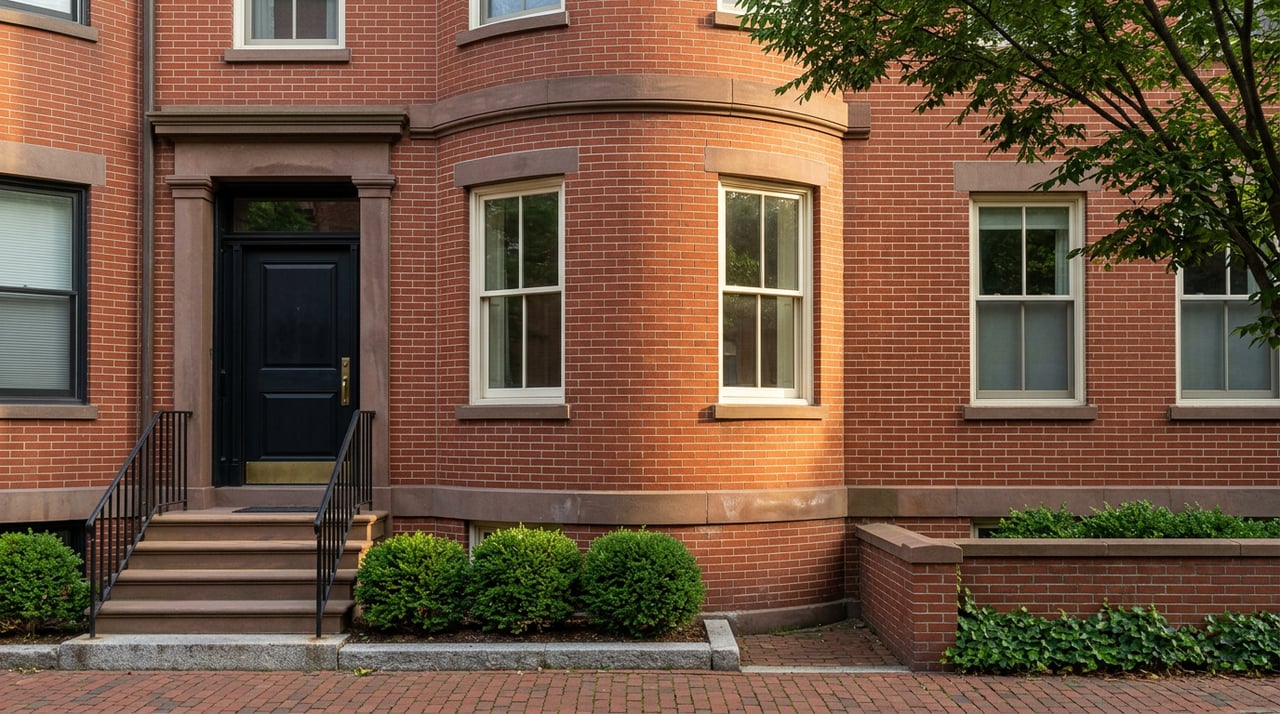
South End tells almost the opposite story. Its housing stock centers on Victorian brownstone row houses built mostly between the 1850s and 1880s, concentrated around squares like Union Park, a landscaped, cast-iron-fenced elliptical park that architectural historians consider the best-preserved residential square in the neighborhood. That stock is fixed. No one is building new nineteenth-century brownstones.
A recent housing-market snapshot showed the split within South End itself. The average South End house price ran $1.12 million in a single recent month, up 16.3 percent year over year. Over the three months ending in May 2026, though, the broader median sale price, blending houses with condos, was up just 0.9 percent to $1.3 million. That gap between the house-only figure and the blended median is the same story playing out at the neighborhood scale that Seaport is playing out at the building scale. The appreciation is concentrated in the segment where supply genuinely cannot expand, not spread evenly across every unit type.
A single-family brownstone on Union Park closed at $12.1 million in 2023, a record that still gets cited as the ceiling reference for the neighborhood's most prestigious block. One market tracker put South End's overall annual appreciation closer to 20 percent, a figure that likely reflects a different sample and time window than the housing-market snapshot above, but the direction agrees: this is a neighborhood where price is rising because the physical stock cannot follow.
Meanwhile South End homes are selling fast. Over that same three-month window ending in May 2026, the typical South End home went under agreement in about 23 days, compared with a 93-day median for Seaport core condos in the three months ending in March 2026. Newer amenity buildings along the Ink Block and SoWa corridors, including The Quinn and Atelier 505, add a modern condo layer on top of the brownstone stock, but the brownstones themselves are what's driving the neighborhood's headline number.
| Submarket | Price per square foot | Typical time to sell | What's actually happening |
|---|---|---|---|
| Seaport core | ~$1,780–$1,940 (Mar. and early Sept. 2026 snapshots) | ~93 days (3 mo. ending Mar. 2026) | Highest sticker price in the city, weighed down by one tower with dozens of unsold units |
| Back Bay | ~$1,450–$1,630 (Mar. 2026 snapshot) | ~44 days (Mar. 2026 snapshot) | Established brownstone and high-rise mix, moving at a steady, unremarkable pace |
| South End | ~$1,100–$1,210 (early 2026 snapshots) | ~23 days (3 mo. ending May 2026) | Lower sticker price, fastest turnover, appreciation concentrated in fixed-supply brownstones |
The instinct to rank neighborhoods by price per square foot treats every unit as fungible. It isn't. Before you let a neighborhood-level number set your expectations, ask what's actually driving it.
In Seaport, ask how many units in a building are still unsold and how long they've sat, not just what the last comp closed at. The pipeline is still real: Fallon's One Harbor Shore is expected to deliver 122 units in late 2026, a 124-unit proposal at 150 Seaport Boulevard was under review as of this spring, and Seaport Square's remaining blocks carry hundreds of thousands of square feet of residential allocation. That's a market where more supply is always one approval away, which caps how much scarcity can drive price on its own.
In South End, the opposite constraint applies. Nobody is adding to the inventory of nineteenth-century brownstones around Union Park or Rutland Square. What you're buying there is a piece of a housing type the city cannot manufacture more of, and the price behavior over the past year reflects that directly.
If you're weighing Back Bay against either, it currently sits in between on both price and pace, an established market that isn't working through an oversupply problem and isn't riding a pure-scarcity story either. It's simply a steady, deep, already-mature market.
Does this mean Seaport is a bad place to buy right now? No. It means the neighborhood-level median isn't the number to anchor on. Mid-market Seaport buildings are moving with confidence at competitive per-square-foot pricing. The caution applies specifically to the ultra-luxury tier above roughly $3 million, where inventory is genuinely oversupplied.
Why would a brownstone with a lower price per square foot be considered the stronger investment? Price per square foot measures what you're paying today. Appreciation measures how that price moves over time. A fixed, unreproducible housing stock tends to appreciate differently than a product type that developers can keep adding to, regardless of which one costs more per square foot right now.
Is the 2026 luxury condo slowdown specific to Boston? The research here is specific to Boston's urban core, drawing on reporting about Seaport and downtown towers. Broader national luxury condo trends may differ, and any comparison across other cities would need separate data.
If you're weighing Seaport, Back Bay, or South End and want a read on what a specific building or block is actually doing right now, not just what the neighborhood median says, the Batya & Alex Team can walk you through the building-level data before you write an offer. Start Your Home Search today.


Our team will elevate your real estate experience, ensuring sellers shine and buyers win in Greater Boston's competitive market. Our dedication goes beyond deals—we're about making dreams a reality, building lasting bonds, and turning complex market challenges into rewarding outcomes for every client.